Recently, I have been given several raw data sets from readers to take a look at. Some of them I have been successful at improving the results and some of them I haven’t. In general, success or lack thereof, seems to be most dependent on the number of cycle slips in the data. So, it’s worth spending a little time discussing this subject.
Cycle slips occur when the receiver loses lock with a satellite and loses count of the number of carrier phase cycles. They can occur on either the base or the roving receiver but tend to be more common when the receiver is moving. They can be caused by obstructions, reflections, high accelerations, vibration, EMI, lack of antenna ground planes, or anything else that degrades the quality of the satellite signal. Once a cycle slip has occurred, the receiver has lost track of the cycle count and can not recover it. This means that the kalman filter state in RTKLIB that is estimating the cycle count offset for that satellite (the phase-bias) must be reset. Even if the cycle slip occurs for only a single epoch, the cycle count is lost for good, and the phase-bias estimate must be reset and re-converged. This can easily take 30 secs or longer.
The best way I have found to evaluate the quality of the raw data regarding cycle slips is to plot the observation data with RTKPLOT. I have had trouble with the 2.4.3 version of RTKPLOT when plotting observation data and have switched back to using the 2.4.2 version for doing this.
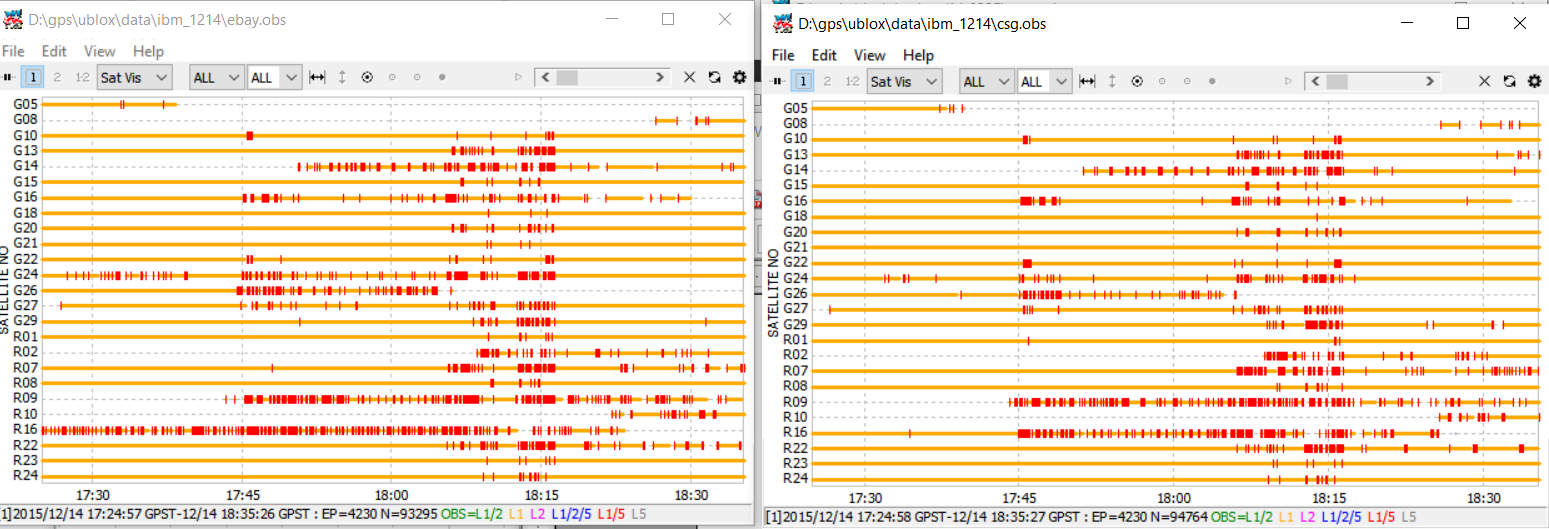
To plot the data, select “Open Obs Data” from the file menu, and select the observation data file (*.obs) for the base receiver. Select “Options” from the Edit menu, and set the “Cycle-Slip” option to “LLI Flag”. Then open a second RTKPLOT window, and do the same for the rover observation data. You should see something like this.

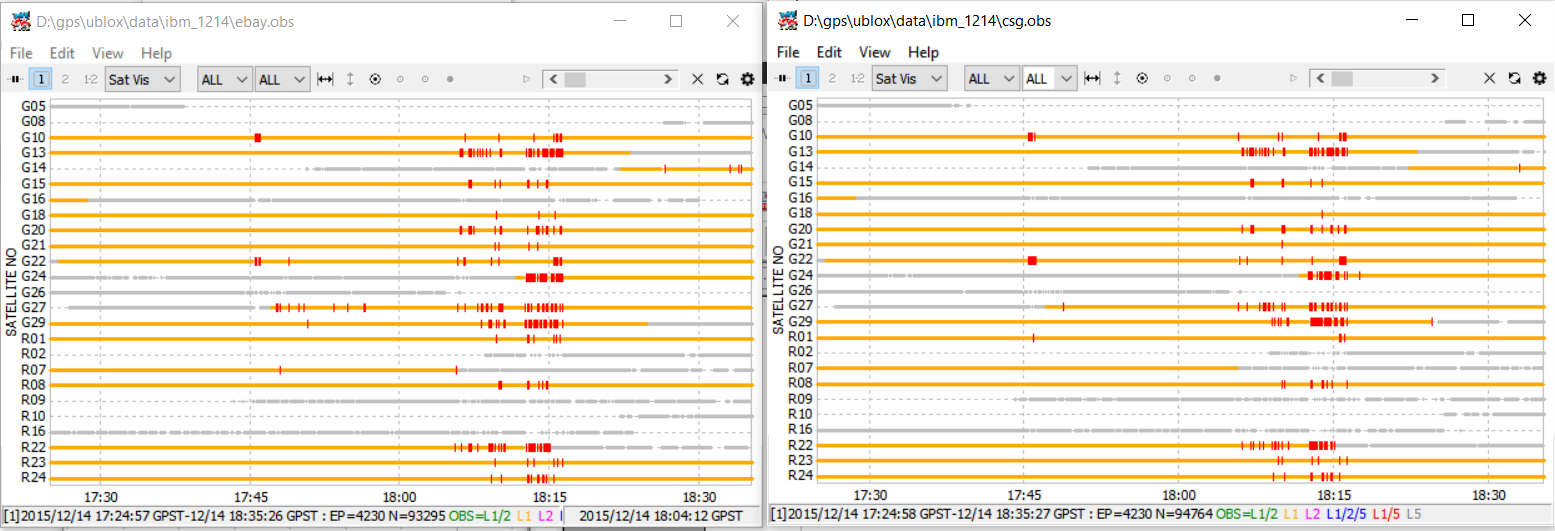
This is the observation data for the parking lot data set used in demo1. Each horizontal yellow line is a different satellite. Each vertical red tick is a cycle slip. The left plot is for the base receiver, the right plot is for the rover receiver. As you can see, some satellites have many more cycle slips than others. In general, the low elevation satellites will have many more cycle slips. In the solutions I ran for this data, I had the elevation mask set to 15 degrees to filter out the lowest elevation satellites. We can remove these satellites from this plot by setting “Elevation Mask” in the RTKPLOT options menu to 15. This gives me the plots show below.

As you can see, the number of cycle slips is significantly reduced by eliminating these satellites. This exercise can be useful when trying to decide what elevation mask to use in the solution configuration file.
Notice that there are still many slips between 18:13 and 18:15 in the data. During this period of time, I had left the parking lot and was driving at higher speeds on roads with obstructed skies. I did not use this part of the data set in my examples and am not able to get good results for this data because of the number of cycle slips.
Here is an example of a data set I was given for which I was not able to get any decent solution for. Again the elevation mask is set to 15 degrees.

In this case the base data is very clean, only a single cycle slip but as you can see, the rover data is very poor for most of the satellites. In this case, the rover receiver was mounted on a drone so the sky should have had good visibility but there may have been antenna, vibration, or EMI issues.
In general, it is worth spending the time up front to minimize the number of cycle slips rather than trying to deal with them later by adjusting RTKLIB input configuration settings. You can use these plots to determine which receiver and/or which satellites are causing most of the cycle slips and then focus on those .
Be sure you are using decent ground planes for your antennas. Ublox recommends using 50-70 square mm ground planes but larger will work as well. There are more suggestions in this document from Ublox for antenna set-up and EMI interference guidelines.
Anything you can do to minimize accelerations will also reduce cycle slips, whether this is reducing maximum acceleration of the rover directly, or improving the mounting so there is not additional vibration or indirect accelerations (e.g. receiver mounted on top of a post).
If nothing else works, you may need to consider investing in higher quality antennas.