Exploring moving-base solutions

As you might guess from the name, a moving-base solution differs from the more common fixed-based solutions in that the base station is allowed to move in addition to the rover. Although it could be used to track the distance between two moving rovers it is more commonly used in a configuration with two receivers attached to a single rover and used to determine heading. Since the receivers remain at a fixed distance from each other, the solution in this case becomes a circle with a radius equal to the distance between the receivers. The location on this circle corresponds to the rover’s heading which is easily calculated using a four quadrant arctan of the x and y components of the position. I also used moving base solutions in several of my earliest posts because the circular nature of the solution makes it easier to verify the solution and to measure errors. Since all solution points should be on the circle, any deviation from the circle can be assumed to be error.

To be more exact, everywhere I mention “circle” above I really should say “sphere” instead since the solution has three dimensions, but if the rover is ground-based, the movements in the z-axis will be relatively small and for simplicity we can assume it is a circle.

In fixed-base solutions, the measurement rate of the base station is often lower than the rover both because it’s location is not changing and also because the base data often has to be transmitted over a data link which may be bandwidth limited. In a moving-base solution, since both receivers are moving, and there is usually no need for a data link since they are both attached to the same rover, it makes sense to use the same data rate for both receivers.

For this exercise, I chose to use a data set I discussed previously in my “M8N vs M8T” series of posts. It consists of two receivers, an M8N and an M8T, on top of a moving car and another M8T receiver used as a fixed base station. The car drives on roads with a fairly open sky view for up to a couple kilometers away from the base station. The base station is located next to some sheds and a tree, so is not ideal, but still has fairly open skies. All three receivers ran at 5 Hz sampling rate and both moving receivers have some missing samples. I’m not sure exactly why this is, it may be because I used a single laptop to collect both data streams. Regardless of where they come from, I have found occasional missing samples are fairly common whenever I collect data at higher sample rates and believe the solution should be robust enough to handle them. The rover M8T data also has a simultaneous cycle-slip type receiver glitch near the beginning of the data as described in my last post. Overall, I would consider this a moderately challenging data set but those are often the best kind for testing the limits of RTKLIB.

Having data from three receivers gives us the luxury of being able to calculate three different solutions (base->rover1, base->rover2, and rover1->rover2) and then compare results between them. Since the first two solutions are fixed-base and the third is a moving-base, it also allows us to validate the moving-base solution using a combination of the two fixed-base solutions.

To start with, let’s calculate solutions for the distance between each moving receiver relative to the fixed base station using the demo5 code and my standard config files for the M8N and M8T receivers. The only difference between the two config files is that the GLONASS ambiguity resolution (gloarmode) is set to “fix-and-hold” for the M8N config file and to “on” for the M8T config file for reasons explained in previous posts. I’ve also done the conversion from raw data to RINEX observation files with the TRK_MEAS and STD_SLIP receiver options set to 2 and 4 respectively, again for reasons previously explained. I set the solution mode to “static-start” since I knew the data set started with the rover stationary for long enough to get a first fix but I also could have used “kinematic” mode.

Subtracting the two fixed-base solutions gives us the distance between the two rover receivers which should be equal to a moving-base solution calculated directly between the two rovers. The only difference is that the errors will be larger in the difference of two solutions than they will be in the direct solution because the errors in the combined solutions will accumulate.

Here are the positions and ground track for the difference between the two solutions, using the “1-2” plotting option in RTKPLOT. As expected we get a circle for the ground track. From the radius of the circle we can tell that the two rovers were about 15 cm apart. Usually you would put the two receivers as far apart as possible, since the errors in the heading will decrease as the distance between the rovers increases but in this case I hadn’t intended to use the results this way so had placed the rovers closer together. Still, it might be representative of a configuration on a small drone or other small rover.


Next let’s try to calculate the solution directly between the two moving receivers. RTKLIB does have a special “moving-base” mode but we won’t use this yet. The “kinematic” solution calculates the distance between the two rovers regardless of the location of the base, so for now we can ignore the fact that the base is moving. This will breakdown eventually if the rover gets too far from the base but since in this data set the rover is only a couple kilometers from the base at its farthest point we should be OK.

The only change I made to the config file from the previous M8N run for this run was to reduce the acceleration input parameters “stats-prnaccelh” and “stats-prnaccelv” which are used to describe the acceleration characteristics of the rover in the horizontal and vertical directions relative to the base. In the fixed-base solution, these need to include both the linear accelerations and rotational accelerations since the rover is moving and the base is fixed, but in the moving-base solution, since we care only about differential acceleration between the receivers, we can ignore the linear accelerations and include only the rotational accelerations. I just used a rough guess and reduced the numbers from (1,0.25) to (0.25,0.1) but I could have found more exact numbers by looking at the acceleration plot of an initial run of the solution.

Here’s the solution using this configuration. It looks reasonable except for the occasional large spikes.

After a little debugging, I found that the spikes were occurring wherever there was a missing sample in the base data. When this occurs, RTKLIB just uses the previous base sample. This works fine when the base is not moving, but in this case that’s no longer true, and the previous base measurements are not good estimates of the current position. We can tell RTKLIB to skip these measurements by setting the maximum age of differential to something less than one sample time. This is done with the “pos2-maxage” input parameter. I set it to 0.1 which is half of one sample time.

With this change, I got the following solution for the position. Much better!

The ground track for this solution is shown below on the right, on the left is the previous ground track derived by subtracting the two fixed-base solutions. As expected, the solutions look very similar except the moving-base solution has smaller errors which appear as deviations from a perfect circle.

To further validate this solution we can compare the heading calculated from the moving-base position with the heading determined from the velocity vector of the fixed-base solution. This wouldn’t work if the rover were a boat, drone, or person, but in the case of a car there are no external lateral drifts and the car will move in the direction it is pointed (unless it’s in reverse of course). This won’t work if the velocity is zero or near zero but for reasonably high velocities we should get a good match. The top plot below shows the difference between the two. The blue line is for all velocities and the red is for when the velocity drops below 5 m/s. The bottom plot shows the distance from the base to the rover.

As expected, the errors are large when the velocities are low but we get a good match otherwise. There also appears to be no correlation between the errors and the base to rover distance which suggests we are well below the maximum base to rover distance before we start to see issues with our assumption that the base did not move.

Overall, this solution looks excellent, with 100% fix and based on deviations from the circle, very small errors. In fact, I recommend this configuration over the RTKLIB “moving-base” solution if you are able to live within the maximum baseline constraints. I don’t know how large that is, but it looks like it may be significantly larger than 2 kilometers which is probably large enough for most applications.

In the next post I will explore what happens when the RTKLIB solution mode is set to “movingbase” in more detail but for now let me bring up just one of its effects since it is something we can also do here without invoking “movingbase” mode and it may have some benefit.

RTKLIB uses an extended kalman filter which is designed to handle non-linearities in the system by linearizing around the current operating point. This generally works quite well but as the system becomes more non-linear, the errors introduced by this approximation grow larger. One way to deal with this is to run multiple iterations of the kalman filter every measurement sample to converge on the correct answer. As we get closer to the correct answer, we will operate closer to the point around which the system has been linearized and the errors will be smaller. There is an input parameter in RTKLIB called “pos2-niter” that specifies the number of filter iterations for each sample. The default value is one but when “posmode” is set to “movingbase” two iterations are automatically added to whatever this value is set to. In the default case, we would get three iterations every sample instead of one. Since the kalman filter assumes all velocities are linear and in the moving-base case we have been looking at, they are all rotational and non-linear, it might make sense to do this. In my example, the sample rate is quite high relative to the rate of rotation and I found it did not help, but in other cases where the rate of rotation is higher relative to the sample rate, it might be a good idea.

So, let me finish by summarizing the changes I recommend for moving-base solutions.

  1. Set measurement sample rate for both rover and base to the same value
  2. Leave “pos1-posmode” set to “kinematic” or “static-start”
  3. Set “pos2-maxage” to half the sample time (e.g 0.1 for 5 samples/sec)
  4. Reduce “stats-prnaccelh” and “stats-prnaccelv” to reflect rotational acceleration only
  5. Experiment with increasing “pos2-niter” from 1 to 3

These recommendations are based on my fairly limited experience with moving-base solutions so if anybody else has other recommendations, please respond in the Comments section.

I have added the data set I used here to the data sets available on the download page for anyone who would like to experiment further with this data.

Here’s another data set taken from two receivers, one at either end of a kayak.  In this case the distance between the two receivers is greater and we see a very clean solution. The two visible deviations from the circle in the plot are caused by rolling the kayak over an embankment at at launch and retrieval.  These large z-axis movements violate the assumption that movements are all in the x-y direction and cause the solution to leave the circle but are still on the three dimensional sphere as described above and are not actual errors.

Demo5 code features

I’ve had a couple questions about what’s different between my demo5 code and the 2.4.3 release code. Here’s a list of what I think are the significant differences.  Any changes that I have made but have then been ported back to the release code are not included here.

 1 Calculation of GPS Solution (RTKNAVI, RTKPOST, RNX2RTKP)

1.1 Significant Functional Differences

(1) The kalman filter state update has been re-written to remove all the zero-element multiplies. This significantly reduces the computation time when receiver dynamics is enabled.

(2) Code has been added to calibrate and manage inter-channel biases for the GLONASS and SBAS satellites based on an extension of the fix-and-hold method (direct feedback from the ambiguity resolution results to the kalman filter states).  This enables use of the GLONASS and SBAS satellites for ambiguity resolution with the M8N receiver or when the base and rover receivers are not identical.

(3) Integer ambiguity resolution has been enhanced to include up to three attempts per sample to resolve the ambiguities using different combinations of satellites. Additional attempts may remove GLONASS and SBAS satellites and/or remove newly acquired satellites depending on various conditions.

(4) Additional adjustable constraints for ambiguity resolution have been added to help minimize the chance of false fixes.

(5) The common component of the phase-biases has been moved to a separate variable instead of spreading it out among all the satellites. This makes the phase-bias states easier to interpret during debug and also removes some issues with improper adding of cycles from satellites with different carrier wavelengths.

(6) Comments have been added to most of the core positioning algorithm code.

(7) The trace output has been enhanced and modified to provide more relevant information for debugging poor solutions.

1.2 Additional Input Parameters and Options

(1) pos1-posmode = static-start: Begins solution in “static” mode but switches to “kinematic” mode after first fix. This mode will normally acquire first fix faster than kinematic mode if the rover is stationary but will fail if the rover starts moving before the first fix.

(2) pos2-gloarmode = fix-and-hold: Extends the fix-and-hold method to calibrate the inter-channel biases for the GLONASS satellites and similar errors for the SBAS satellites. Note that fix-and-hold feedback only occurs after the first fix.

(3) pos2-arfilter = on,off: Rejects new or recovered satellites from being used in ambiguity resolution if the AR ratio was significantly degraded by their addition. This is an alternative or enhancement to using the blind delay of “arlockcnt” since the satellite will only be left out of the solution as long as necessary instead of for a fixed length of time.

(4) pos2-arthres1 = x: Integer ambiguity resolution is delayed until the variance of the position state has reached this threshold. It is intended to avoid false fixes before the kalman filter has had time to converge. If you see AR ratios of zero extending too far into your solution, you may need to increase this value. The “arthres1” option exists in the release code config file but is not used for anything.

(5) pos2-minfixsats = n: Minimum number of sats necessary to get a fix. Used to avoid false fixes from a very small number of satellites, especially during periods of frequent cycle-slips.

(6) pos2-minholdsats = n: Minimum number of sats necessary to hold an integer ambiguity result. Used to avoid false holds from a very small number of satellites, especially during periods of frequent cycle-slips.


2 Conversion from raw data to RINEX (RTKCONV, CONVBIN, RTKNAVI)

2.1 Significant Functional Differences

(1) The M8T raw output to cycle-slip translation algorithm has been modified to more closely match that of the M8N. This insures that a cycle-slip is flagged after every loss-of-lock and is not flagged until the carrier phase measurement quality is sufficient for resetting the phase-bias estimate.

(2) The half-cycle invalid bit is set for the SBAS satellites based on lock-time since the half-cycle invalid bit from the receiver is not functional for these satellites. This change has been made for both the M8N and M8T in the demo5 code but has only been ported back to the 2.4.3 code for the M8N receiver.

(3) The receiver measurement quality metrics for each sample are recorded in the RINEX observation files. The single character SNR field in the pseudorange and carrier-phase measurements are used for this purpose. The M8T reports quality metrics for both pseudorange and carrier-phase, the M8N reports quality metrics only for the carrier-phase. This is for information purposes only, RTKLIB does not use these fields.

2.2 Receiver Specific Options (U-blox)

(1) -STD_SLIP = x: Carrier phase measurements are flagged as cycle-slips if the standard deviation of the carrier phase measurement (as reported by the receiver) is greater or equal to x (scale=0.04 meters/count). This feature now exists in both  the 2.4.3 and the demo5 codes but is not listed in the 2.4.3 documentation. It is only used for the M8T receiver. If this option is not set, then the same fixed threshold will be used for cycle-slips as for valid carrier-phase measurements, which in the release code can cause cycle-slips to fail to be flagged after the phase-bias estimate is valid.

Another Raspberry Pi RTKLIB project

After describing my simple Pi based data logger in my last post, I stumbled across this Raspberry Pi based GPS project on diydrones.com.  It uses an M8T receiver and includes a touchscreen GUI to manage RTKLIB.  It has downloadable files for 3D printing the case as well as an image file with all the code for the SD card (something I should probably provide with mine).

I haven’t looked at in great detail but it seems very intriguing and could be a good alternative to what I described in my last post if you are looking for something with greater capability.

Here’s a photo of the completed project.

rtkbase3

Improving RTKLIB solution: (AR lock count and elevation mask)

In the previous post, after a couple changes to the input parameters, we ended up with the following solution for the difference between two stationary, then moving Ublox receivers:

During the time when the receivers were stationary (17:25 to 17:45), we were able to hold a fixed solution (green in plot) continuously after the initial convergence, but started to revert to float solution (yellow in plot) fairly frequently once the receivers started moving.

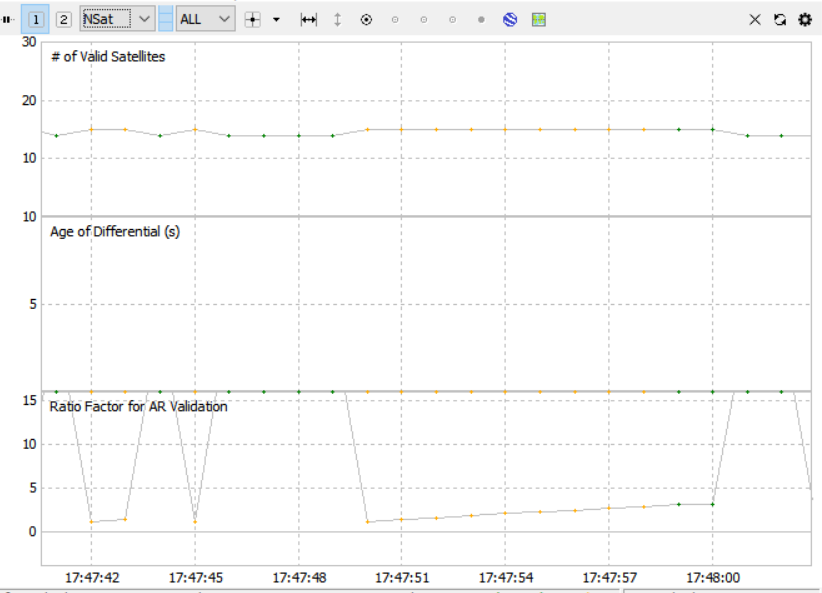
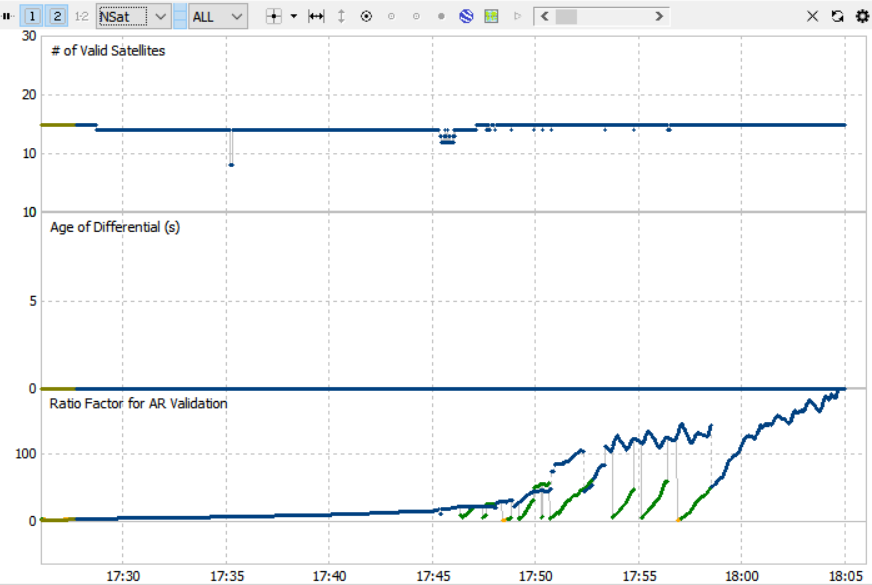
Let's look at the data a little closer to see if we can discern why we are reverting back to the float solution. If we switch to the “Nsat” view in RTKPLOT plotted below, we can see a couple of useful plots.

sol9c

The top plot shows the number of satellites used for the solution and the bottom plot show the AR ratio factor. The AR ratio factor is the residuals ratio between the best solution and the second best solution while attempting to resolve the integer cycle ambiguities in the carrier-phase data. In general, the larger this number, the higher confidence we have in the fixed solution. If the AR ratio exceeds a set threshold, then the fixed solution is used, otherwise the float solution is used. I have left this threshold at its default value of 3.0.

Notice in the plot that each time we revert to the fixed solution, it happens when the number of valid satellites increases. At first this seems counter-intuitive, you would think that more information would improve the solution, not degrade it. What is happening though, is that the solution is not using the satellite data directly, but rather, the kalman filter estimate of the data. This estimate improves as the number of samples increases. This is also why the solution takes some time to converge at the beginning of the data. By using the data from the new satellite before the kalman filter has had time to converge, we are adding large errors to the solution, forcing us back to the float solution.

Fortunately, RTKLIB has a parameter in the input configuration file to address this issue. “Pos2-arlockcnt” sets the minimum lock count which has to be exceeded before using a satellite for integer ambiguity resolution. This value defaults to zero, but let's change it to 20 and see what happens. While we are it, we will also change the related parameter “pos2-arelmask” which excludes satellites with elevations lower than this number from being used. We will change this from it's default of 0 to 15 degrees.

Unfortunately, re-running the solution with these changes makes almost no difference as seen below. The jumps back to float solutions still occur immediately after a new satellite is included, and the additional satellites are being included at the same epochs. Something is clearly wrong.


Digging into the code a bit reveals the problem. First, the arlockcnt input parameter is copied to a variable called “rtk->opt.minlock” Then the relevant lines of code from rtkpos.c are:

rtk->ssat[sat[i]-1].lock[f]=-rtk->opt.minlock;

if (rtk->ssat[i-k].lock[f]>0&&!(rtk->ssat[i-k].slip[f]&2)&&
     rtk->ssat[i-k].azel[1]>=rtk->opt.elmaskar) {
     rtk->ssat[i-k].fix[f]=2; /* fix */
     break;
}
else rtk->ssat[i-k].fix[f]=1;

So far, everything looks OK, but when we look at the definition for the structure member “lock” in rtklib.h we find:

unsigned int lock [NFREQ]; /* lock counter of phase */

This won't work. We are assigning a negative number (-rtk->opt.minlock) to an unsigned variable, then checking if the unsigned variable is greater than zero, which by definition, will always be true. Hence, satellites are always used immediately, regardless of lock count.

We fix this bug by changing the definition of lock from unsigned to signed:

int lock [NFREQ]; /* lock counter of phase */

Rerunning after rebuilding the code, gives us the following solution:

Much better! All but a couple of the jumps back to float solutions have been eliminated.

Looking at the plot of the AR ratio for this solution, we can see that the kalman filter requires more than 20 seconds (the value we chose for arlockcnt) to re-converge. Two minutes looks like a more reasonable value from the plot, so let's try rerunning the solution with arlockcnt=120.

Even better.  That eliminates the last couple of jumps back to the float solution and also significantly reduces the number of jumps in the AR ratio plot as shown below. The green line in the bottom plot is arlockcnt=20 and the blue line is arlockcnt=120.

sol12c

It's possible we will need to revisit this number after looking at more data, but for now we will use 120 secs.

As always, please leave a comment if you have any comments, discussion points, or questions.

Update 4/11/16:  

  • In the above discussion, my data is one epoch/sec and I equate epochs with seconds.  Arlockcnt is specified in epochs, not seconds, so if your data is at a different sample rate you will need to adjust accordingly.
  • The suggestion above to set arlock to 120 secs is probably too conservative for more challenging environments.  If there are few satellites and/or many cycle slips for example it is probably better to start using a just-locked satellite before it is fully converged.  I have started using 30 secs rather than 120 secs for my solutions.
  • You can pull this code fix from my github repository either by itself from the arlockcnt branch or as part of a larger set in the demo1 branch

Plotting Observation Data: Cycle Slips


Recently, I have been given several raw data sets from readers to take a look at. Some of them I have been successful at improving the results and some of them I haven’t. In general, success or lack thereof, seems to be most dependent on the number of cycle slips in the data. So, it’s worth spending a little time discussing this subject.

Cycle slips occur when the receiver loses lock with a satellite and loses count of the number of carrier phase cycles. They can occur on either the base or the roving receiver but tend to be more common when the receiver is moving. They can be caused by obstructions, reflections, high accelerations, vibration, EMI, lack of antenna ground planes, or anything else that degrades the quality of the satellite signal. Once a cycle slip has occurred, the receiver has lost track of the cycle count and can not recover it. This means that the kalman filter state in RTKLIB that is estimating the cycle count offset for that satellite (the phase-bias) must be reset. Even if the cycle slip occurs for only a single epoch, the cycle count is lost for good, and the phase-bias estimate must be reset and re-converged. This can easily take 30 secs or longer.

The best way I have found to evaluate the quality of the raw data regarding cycle slips is to plot the observation data with RTKPLOT. I have had trouble with the 2.4.3 version of RTKPLOT when plotting observation data and have switched back to using the 2.4.2 version for doing this.

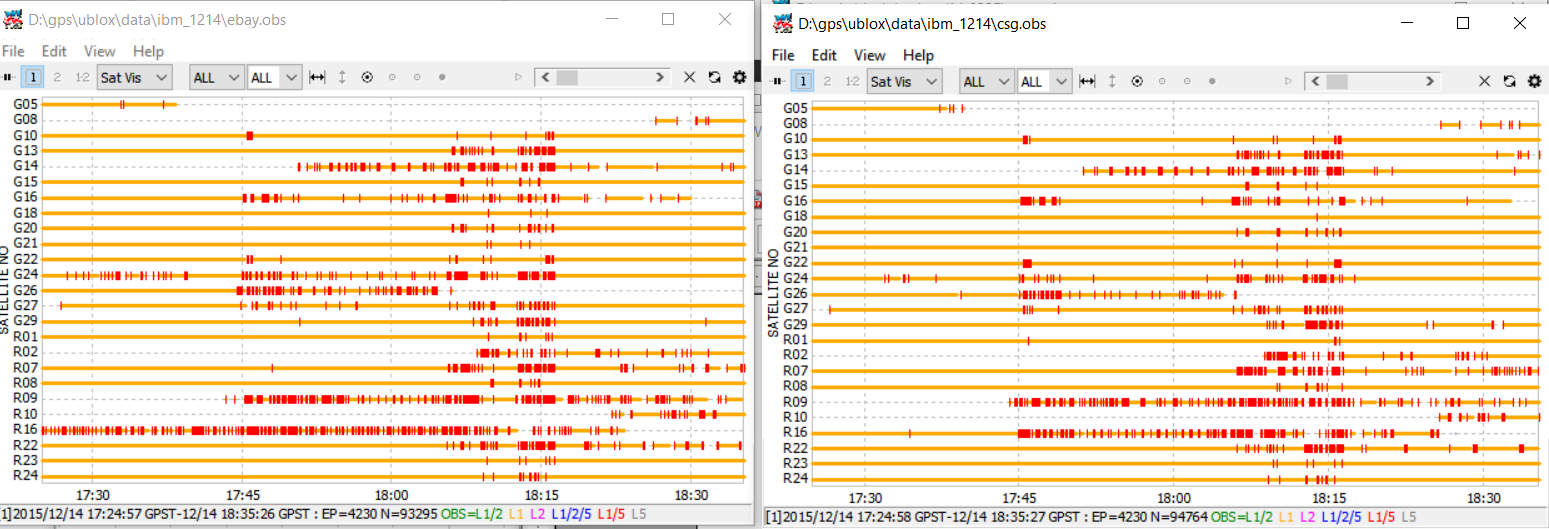
To plot the data, select “Open Obs Data” from the file menu, and select the observation data file (*.obs) for the base receiver. Select “Options” from the Edit menu, and set the “Cycle-Slip” option to “LLI Flag”. Then open a second RTKPLOT window, and do the same for the rover observation data. You should see something like this.

slips1.png


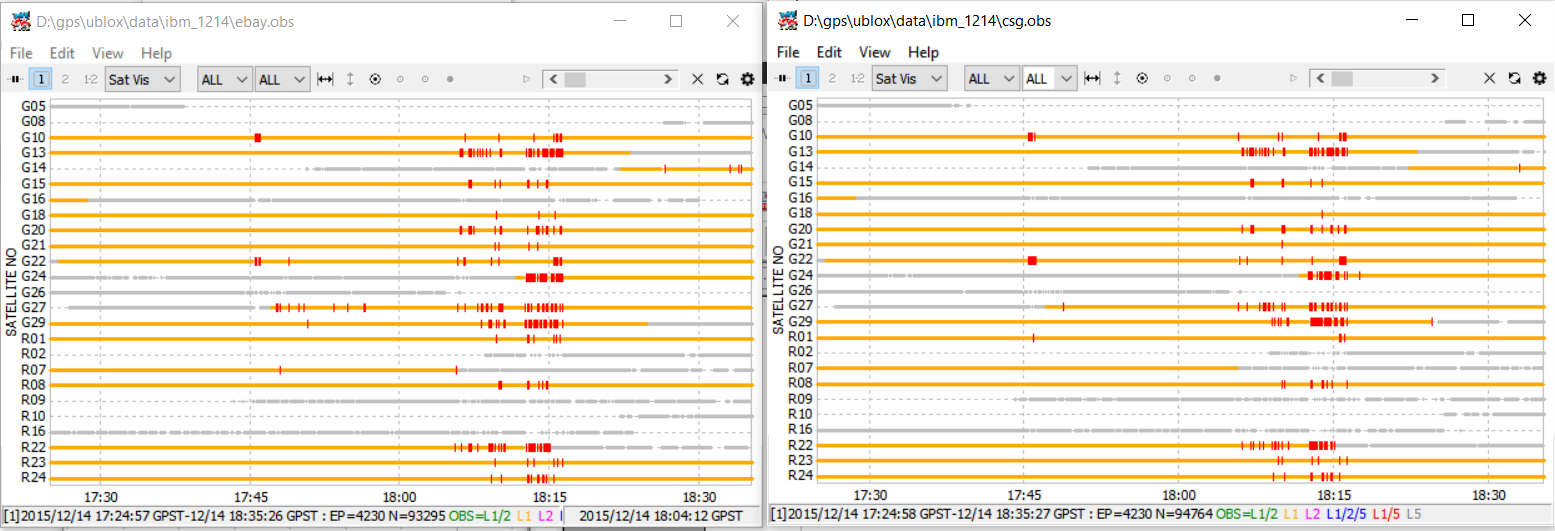
This is the observation data for the parking lot data set used in demo1. Each horizontal yellow line is a different satellite. Each vertical red tick is a cycle slip. The left plot is for the base receiver, the right plot is for the rover receiver. As you can see, some satellites have many more cycle slips than others. In general, the low elevation satellites will have many more cycle slips. In the solutions I ran for this data, I had the elevation mask set to 15 degrees to filter out the lowest elevation satellites. We can remove these satellites from this plot by setting “Elevation Mask” in the RTKPLOT options menu to 15. This gives me the plots show below.

slips2.png

As you can see, the number of cycle slips is significantly reduced by eliminating these satellites. This exercise can be useful when trying to decide what elevation mask to use in the solution configuration file.

Notice that there are still many slips between 18:13 and 18:15 in the data. During this period of time, I had left the parking lot and was driving at higher speeds on roads with obstructed skies. I did not use this part of the data set in my examples and am not able to get good results for this data because of the number of cycle slips.

Here is an example of a data set I was given for which I was not able to get any decent solution for. Again the elevation mask is set to 15 degrees.

slips3.png

In this case the base data is very clean, only a single cycle slip but as you can see, the rover data is very poor for most of the satellites. In this case, the rover receiver was mounted on a drone so the sky should have had good visibility but there may have been antenna, vibration, or EMI issues.

In general, it is worth spending the time up front to minimize the number of cycle slips rather than trying to deal with them later by adjusting RTKLIB input configuration settings. You can use these plots to determine which receiver and/or which satellites are causing most of the cycle slips and then focus on those .

Be sure you are using decent ground planes for your antennas. Ublox recommends using 50-70 square mm ground planes but larger will work as well. There are more suggestions in this document from Ublox for antenna set-up and EMI interference guidelines.

Anything you can do to minimize accelerations will also reduce cycle slips, whether this is reducing maximum acceleration of the rover directly, or improving the mounting so there is not additional vibration or indirect accelerations (e.g. receiver mounted  on top of a post).

If nothing else works, you may need to consider investing in higher quality antennas.

Building RTKLIB 2.4.3 code with Visual C++ 2010

One of my goals in this project is to make some changes to the RTKLIB solution algorithms and evaluate them specifically for my set of inputs. RTKLIB is intended to work in many different environments. I would like to customize it to be optimal for calculating differential solutions for two single frequency receivers assuming low velocities and open skies. Some of the changes I would like to make are based on what other people have already tried but for which code is not available. Other changes are based on looking at cases in my data where RTKLIB did not provide a good solution, understanding why, and changing the algorithm appropriately.

To make these changes, I need to be able to modify the RTKLIB code and rebuild it. Since I am doing this initial evaluation work on a Windows PC I will need to build the code in that environment. The GUI versions of the RTKLIB programs require the Embarcadero C++ compiler which I do not have and which is fairly expensive to purchase. The CUI versions can be built with Visual C++, which is available for free, so I have chosen to go that path. As mentioned before, I also find the CUI interface with a matlab wrapper better for tracking configuration information for multiple runs.

The project files for Visual C++ are in the rtklib\app\”app name”\msc folders. They are configured for Visual C++ 2008. Since I already have Visual C++ 2010 loaded on my machine I had to make a few changes to make the project files work. Some of the changes would also be required with VS 2008 since it does not look like the project files have been kept up to date with recent RTKLIB changes.

  1. Convert solution files to VS 2010: Click on msc.sln file in rtklib\app\rnx2rtkp\msc folder. This will bring up the visual studio conversion wizard which will convert the VC 2008 project files to VC 2010.
  2. Add new src files to project: Add tides.c and ppp_corr.c to the list of source files in the “Solution Explorer” window by right-clicking on the source folder and selecting “Add”. This prevents build errors from unfound symbols.
  3. Modify Include Directories: Select “Properties” from “Project” tab. Select “General” under “C/C++” under “Configuration Properties” in the menu on the left hand side. Replace the existing entry with “..\..\..\src” to make it independent of code path. This enables the compiler to find the rtklib.h file.
  4. Modify Target Name: Select “General” under “Configuration Properties” in the the menu on the left hand side and change “Target Name” to “rnx2rtkp” to avoid linking errors.
  5. Add winmm library: Select “Input” under “Linker” under “Configuration Properties” in the menu on the left hand side, and add “winmm.lib” to “Additional Dependencies”. This avoids linker errors for an unresolved TimeGetTime symbol.
  6. Fix LPCWSTR conversion warning: Select “General” under “Configuration Properties” in the the menu on the left hand side and change “Character Set” from “Use Unicode” to “Not Set”

To run these apps from the data folders you will need to add the paths for the executables to your Windows path variable. The executables are in app/”app name”/Release/”app name”.exe or app/”app name”/Debug/”app name”.exe depending on whether you built in Debug or Release mode. I always build in Debug mode and point my path variable to that folder just to make it easier to switch between debugging with VS and running stand-alone, but either will work.

Kinematic solution with RTKPOST

Kinematic solution with RTKPOST

RTKPOST is the GUI tool in RTKLIB to calculate position solutions. Most of the time I find the CUI version (RNX2RTKP) better fits my needs, but just to check everything is working, it is probably easier to use RTKPOST the first time.

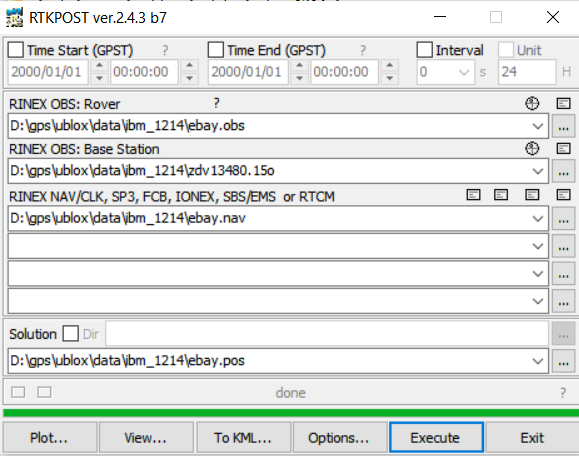
For a demonstration of using RTKPOST to find a kinematic position solution, I will use the ZDV1 (COREX station data) for base station data and the “EBAY” (Ublox M8N receiver data) for rover data. Zipped versions of this data is available here.  Since the exact location of ZDV1 is known and is in the observation file header, the kinematic solution will give us an absolute position by solving for the relative distance between the rover and the base, and then adding that to the base location. I set up the GUI inputs as shown below to point the program to the correct observation and navigation files. If you use my data, be sure to change the paths to match where you saved the data to.

rtkpost

For this first run, to keep things as simple as possible, we will make just two changes from the default setup. Use the “Options” button to get to the options menu. Under the “Setting 1” tab, change “Positioning mode” from “Single” to “Kinematic”. This will give us a differential solution using carrier phase info instead of an absolute solution using only pseudorange. Next, under the “Positions” tab, change the first field under “Base Station” from “Lat/Lon/Height” to RINEX Header Position. This will tell RTKPOST to get the base station location from the header of the observation file.

While you are in the options menu, click the “Save” button, and save the options setup to a location you will remember later. We will use this file as the configuration input file for the CUI version. Then click OK to exit the Options menu.

Click the “Execute” button to calculate position and then “Plot” to see the solution. Select “Gnd Trk” and zoom in and it should look like this. The two rectangles are parking lots. The yellow represents a float solution, the green a fixed solution. The fact that we were able to get a fixed solution at least part of the time is a sign things are working reasonably well.

sol1

Zooming into the initial time period when the car was stationary we see the plot below. Since the receiver is not moving during this time, any movement in the solution represents error. During the initial convergence of the kalman filter we see quite a lot of error, but once it does converge, we do get a fixed solution for 5 of the 20 minutes which appears as green in the plot below. During this time you can see the error is roughly +/- 1cm in the xy direction which again is a good sign things are working.

sol2

Note about restoring RTKPOST default options:  There is no button in RTKPOST to reset the options to defaults and it remembers the options from the previous session when restarted, so there is no obvious way to put it back to defaults.  The best way I have found to do this is to delete the “rtkpost.ini” file saved in the rtklib\bin folder before starting RTKPOST.

Kinematic solution with RNX2RTKP


In the last post we used the RTKPOST GUI to generate a kinematic position solution using “ebay.obs” for the rover data and “zdv13480.15o” for the base station data. To do the equivalent run from RNX2RTKP we use the following command line, run from the folder containing the data files.

rnx2rtkp -k test1.conf -o out.pos ebay.obs zdv13480.15o ebay.nav

The -k option is to specify the configuration file, the -o option is the output file. In this case we use the configuration file we saved from RTKPOST in the previous post.

To plot the calculated solution use the following command line:

rtkplot out.pos

This calls up the same plot GUI we previously accessed by clicking on the “Plot” button in the RTKPOST GUI.

The plots should be identical between this solution and the previous solution generated with RTKPOST.

To keep track of changes between various runs with the same data, I use a matlab wrapper to create a sub-folder, copy the config file, trace file, stats file, and result file to that sub-folder, input a short description of the run, and also save that to the sub-folder.

Base station data for RTKLIB

RTKLIB has a number of different algorithms it can use to calculate position. The first two in the list are “Single” and “DGPS”. Both of these methods use only the pseudorange data and not the carrier phase information. Without the carrier phase information, the precision of these methods is quite low, and probably worse than what the GPS receiver would provide without RTKLIB. In general they are not very interesting other than possibly for some initial debug during setup. The rest of the algorithms can be divided into two groups, differential and PPP. The differential algorithms determine position relative to a known nearby location while the PPP (precise point positioning) algorithms determine absolute position. In general, the data quality of the low cost hardware we are using is only good enough to use with the differential methods and not the PPP methods, so we will focus on those. RTKLIB supports four differential modes: Static, Kinematic, Moving-Base, and Fixed. The kinematic mode is designed to calculate the relative position between a fixed base and a moving rover and that is what we will use. It can also be used with a moving base if we are concerned only with finding the distance between the two and not trying to translate that to a fixed position, and we will use it this way as well.

In my particular application, I am interested only in the distance between two receivers and not in any absolute locations. In this case I will collect data from two low-cost receivers and use one as the base and the other as the rover. In many cases, though, it is useful to use an existing ground station as the base and the low cost receiver as the rover. I use this method for testing and verification, even though I don’t plan to use it in my final solution.

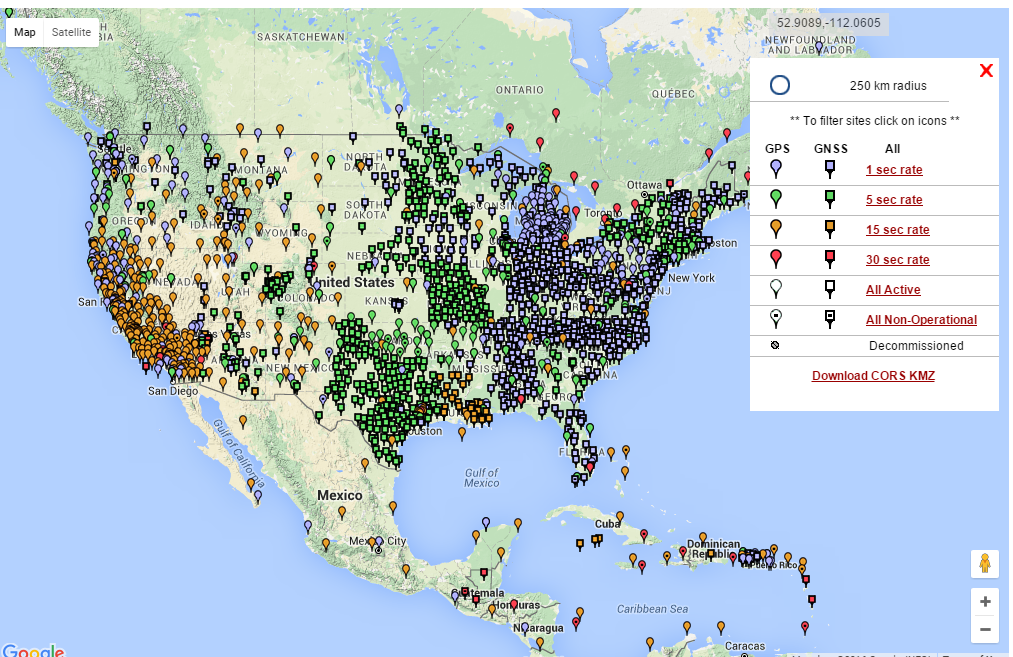
In the US, base data is available online for free from many GPS stations in the CORS network.  Here’s a map of CORS station locations.

cors_map.PNG

For the ground stations I have used, it is generally available online less than an hour after it is taken. It is fairy easy to pull it manually using a user-friendly form from the CORS webpage, or you can use the RTKGET utility in RTKLIB. Be aware that some stations have only GPS data, and some have both GPS and GLONASS data.

Converting raw receiver data to standard text format using CONVBIN

At this point, we have collected raw receiver output data in a Ublox binary format file. We need to convert this to RINEX format before RTKLIB will process it. RINEX (Receiver Independent Exchange Format) is a standard text data format supported by many receivers and post‐processing analysis software.

This can be done with RTKCONV, the GUI conversion program in RTKLIB, but I prefer to use CONVBIN, the CUI version.  To avoid having to remember the exact command format, I automate the call with a simple matlab wrapper. To convert binary data from a file named "testdata.ubx" the format of the command to CONVBIN will look like this:

convbin -od -os -oi -ot -f 1 -ts 2015/12/14 17:25:00 -te 2015/12/14 18:25:00 testdata.ubx

The command line options are all well documented in the RTKLIB user manual and there are many I am not using but here's a brief explanation of the options I am using:

-od: include doppler frequency data in observation output file

-os: include SNR data in observation output file

-oi: include iono correction in nav output file header

-ot: include time correction in nav output file header

-f 1: one frequency (L1 only)

-ts: start time

-te: end time

I leave off the start time and end time options when I choose to process the complete file.

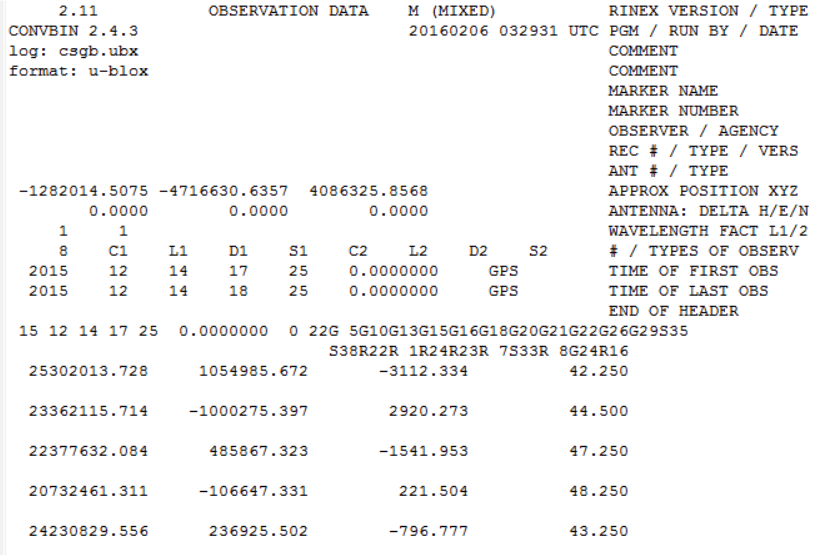
The output of this command will be a set of text files. The .obs file contains the observation data which in this case is the pseudorange, carrier phase, doppler, and SNR from each satellite for each epoch. The start of this file should look something like this:

obsfile

The top section is the file header, followed by a timedate stamp and list of satellites for the first epoch. After that is a list of pseudorange, carrier phase, doppler, and SNR numbers for five satellites from the first epoch, each row being one satellite. See here for a complete description for the RINEX observation file data format.

There will also be a .nav file containing navigation data for the GPS satellites, a .gnav file for GLONASS navigation data, a .hnav file for geosynchronous satellite navigation data and a .sbs file containing SBAS correction data. All of these files are in text format and we will need most, if not all of them, as inputs to generate position data.

The data is now in a standard format that can be processed by RTKLIB to determine position.